All Articles
Updated Chart Visuals and Chart Info Tool
July 11, 2025 • 3 min read
Get a better understanding of your surroundings – for smarter and easier boating.
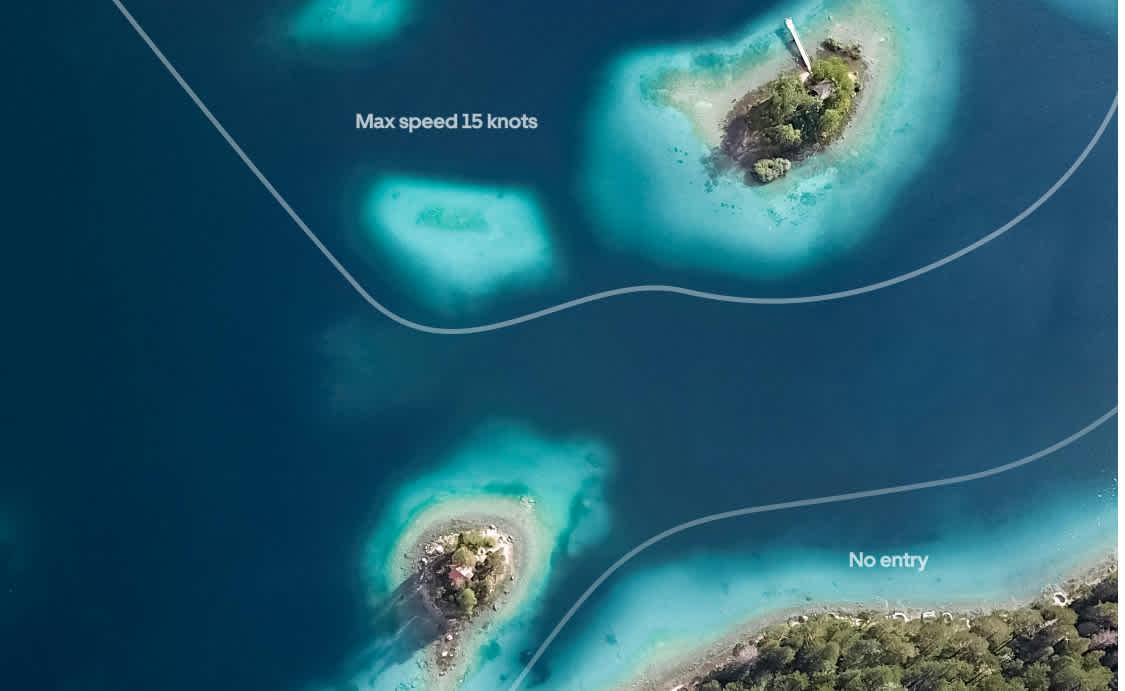
Marine charts are complex. They contain information across various domains, including bathymetry, marks, restricted areas, lights, and shipping lanes. Remembering the meaning of these symbols and patterns takes exercise and repetition.
Orca’s chart philosophy is that charts should be easy to read and quickly understood. Orca Charts are carefully designed to strike a balance between legibility and information density, with the ultimate goal of minimizing the time and cognitive effort required to understand your surroundings.
This week’s update introduces a set of improvements to chart visuals, along with a better way to understand the meaning of each chart element and its impact on navigation.
Updated Visuals
This release improves how Orca Charts present important navigational information, in particular at lower and medium zoom levels. The goal is to make the chart more useful for ambitious boaters who do long-distance trips, without compromising clarity, legibility, and ease-of-use. Here are the changes:
1. Better visualization of wind farms
Offshore wind farms are present in many boating areas. In the latest chart update, wind farms are now clearly labeled at lower zoom levels, making long-distance planning easier.
This is especially useful in areas like the British Channel, the coastlines of the Netherlands and Germany, and the waters between Denmark and Sweden, where wind farms are numerous.
At lower zoom levels, wind farm icons disappear and get replaced by the new wind farm zone pattern and label.
2. Understand shipping traffic paths with recommended route centerlines
Recommended route centerlines are lines that indicate a recommended route for large commercial vessels.
While these centerlines are not relevant as navigational aids for recreational boaters, seeing these lets you know where to expect shipping traffic. To help better understand where to expect shipping traffic, Orca now shows these centerlines.
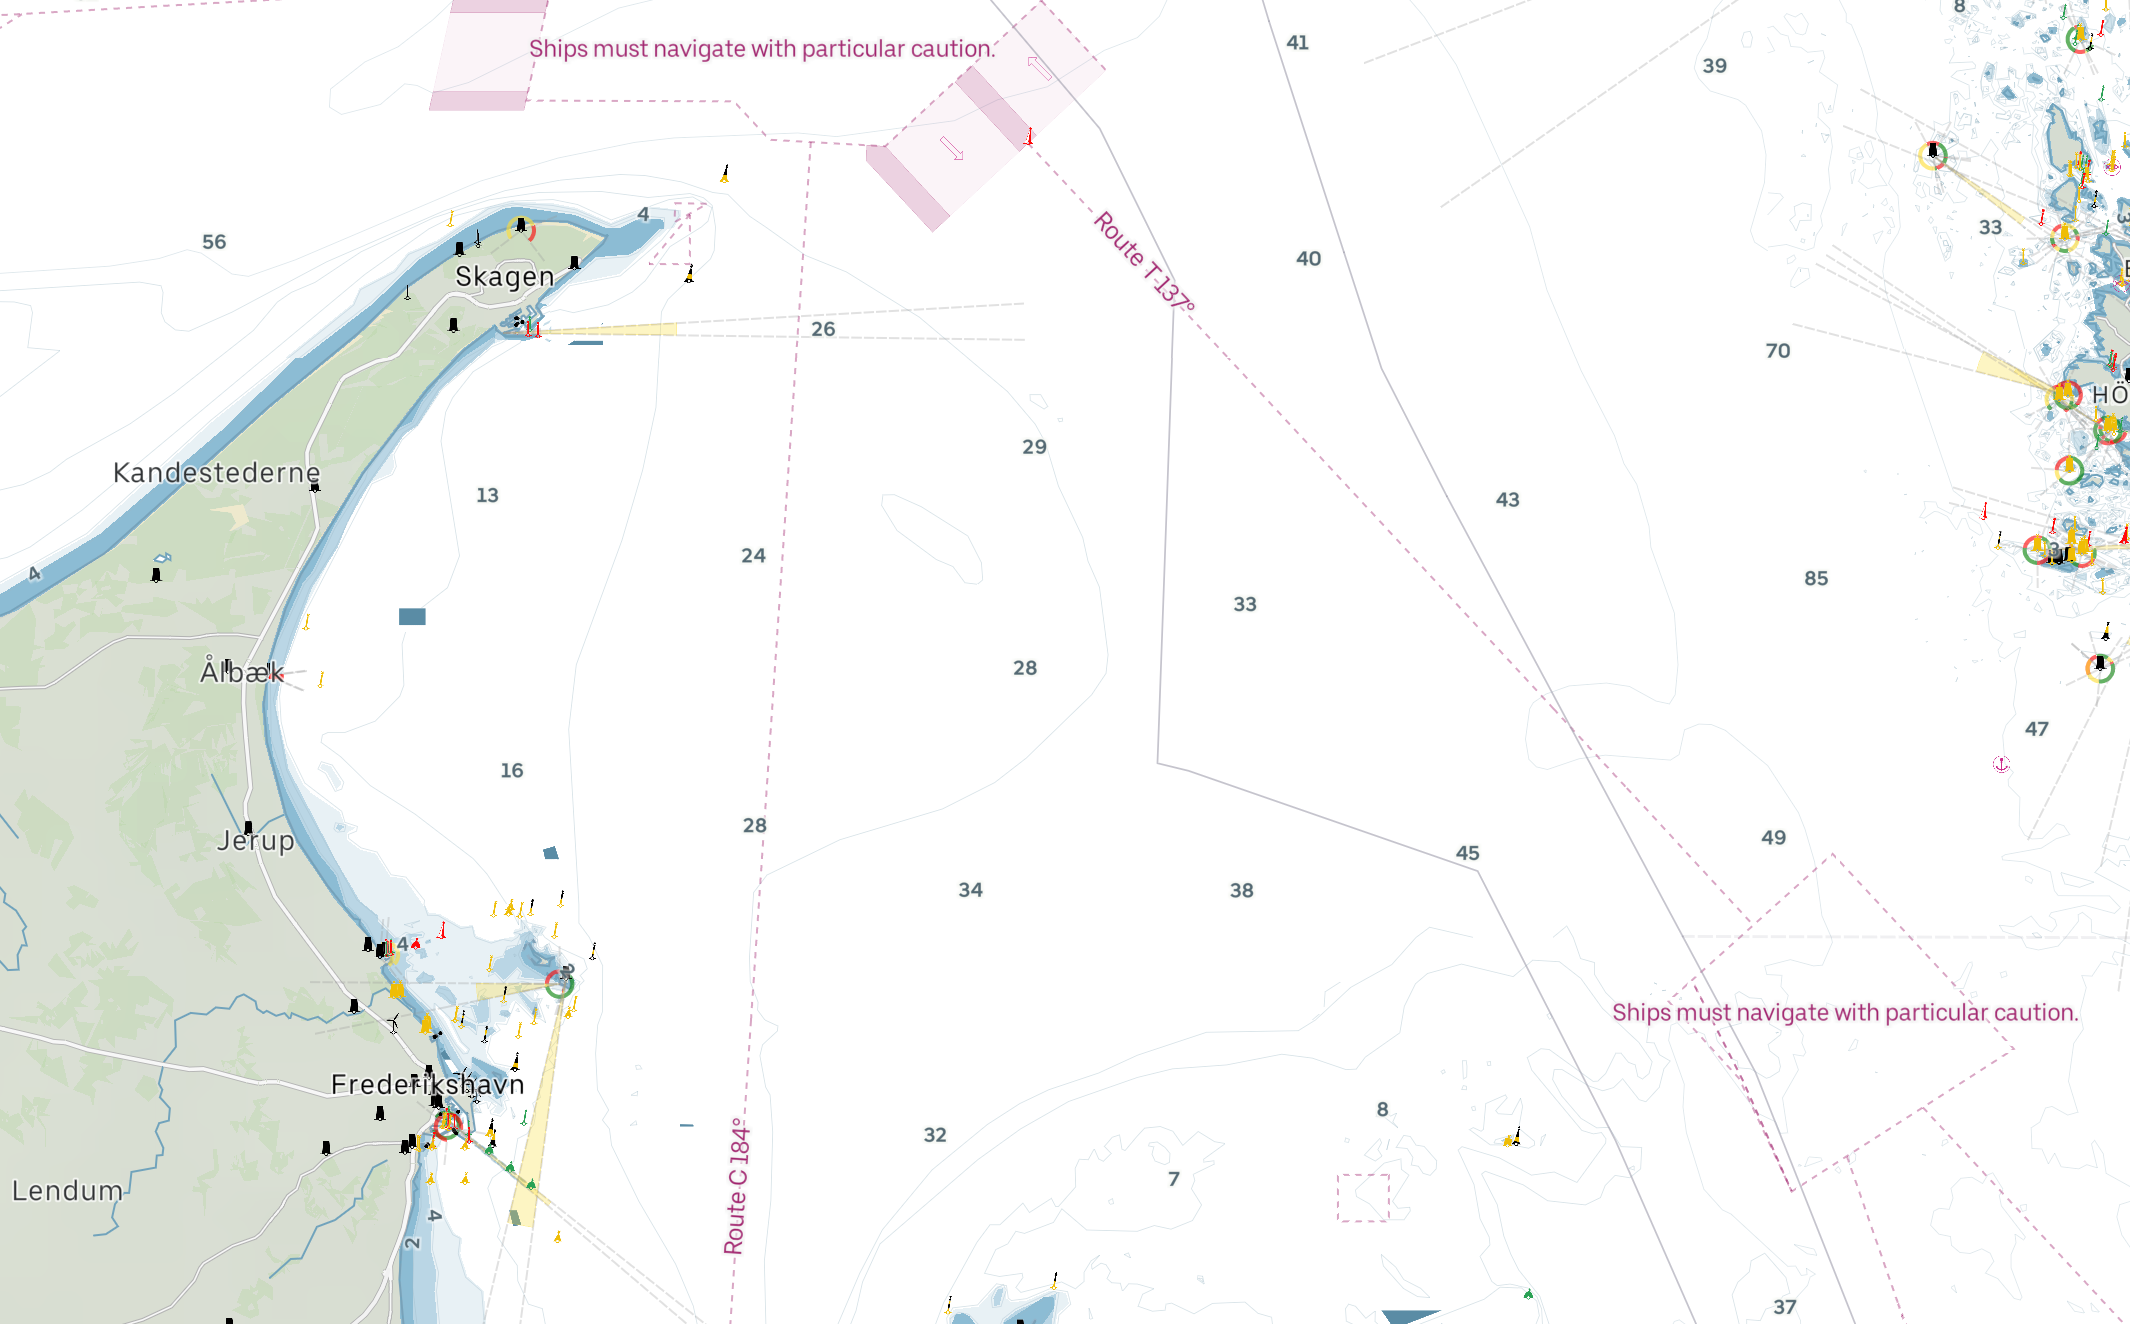
Recommended Centerlines are now marked with their route name and bearing. This makes it easy to understand where you can expect shipping traffic.
3. Easier night navigation with light height and range labels
Orca delivers exceptional light characteristics with leading light and light range indicators in the charts. Light labels are now upgraded to the same level, showing both range and height of the light itself. The addition of height makes it easier to correlate a light in the map with what you see in the dark when navigating in areas with multiple light sources.
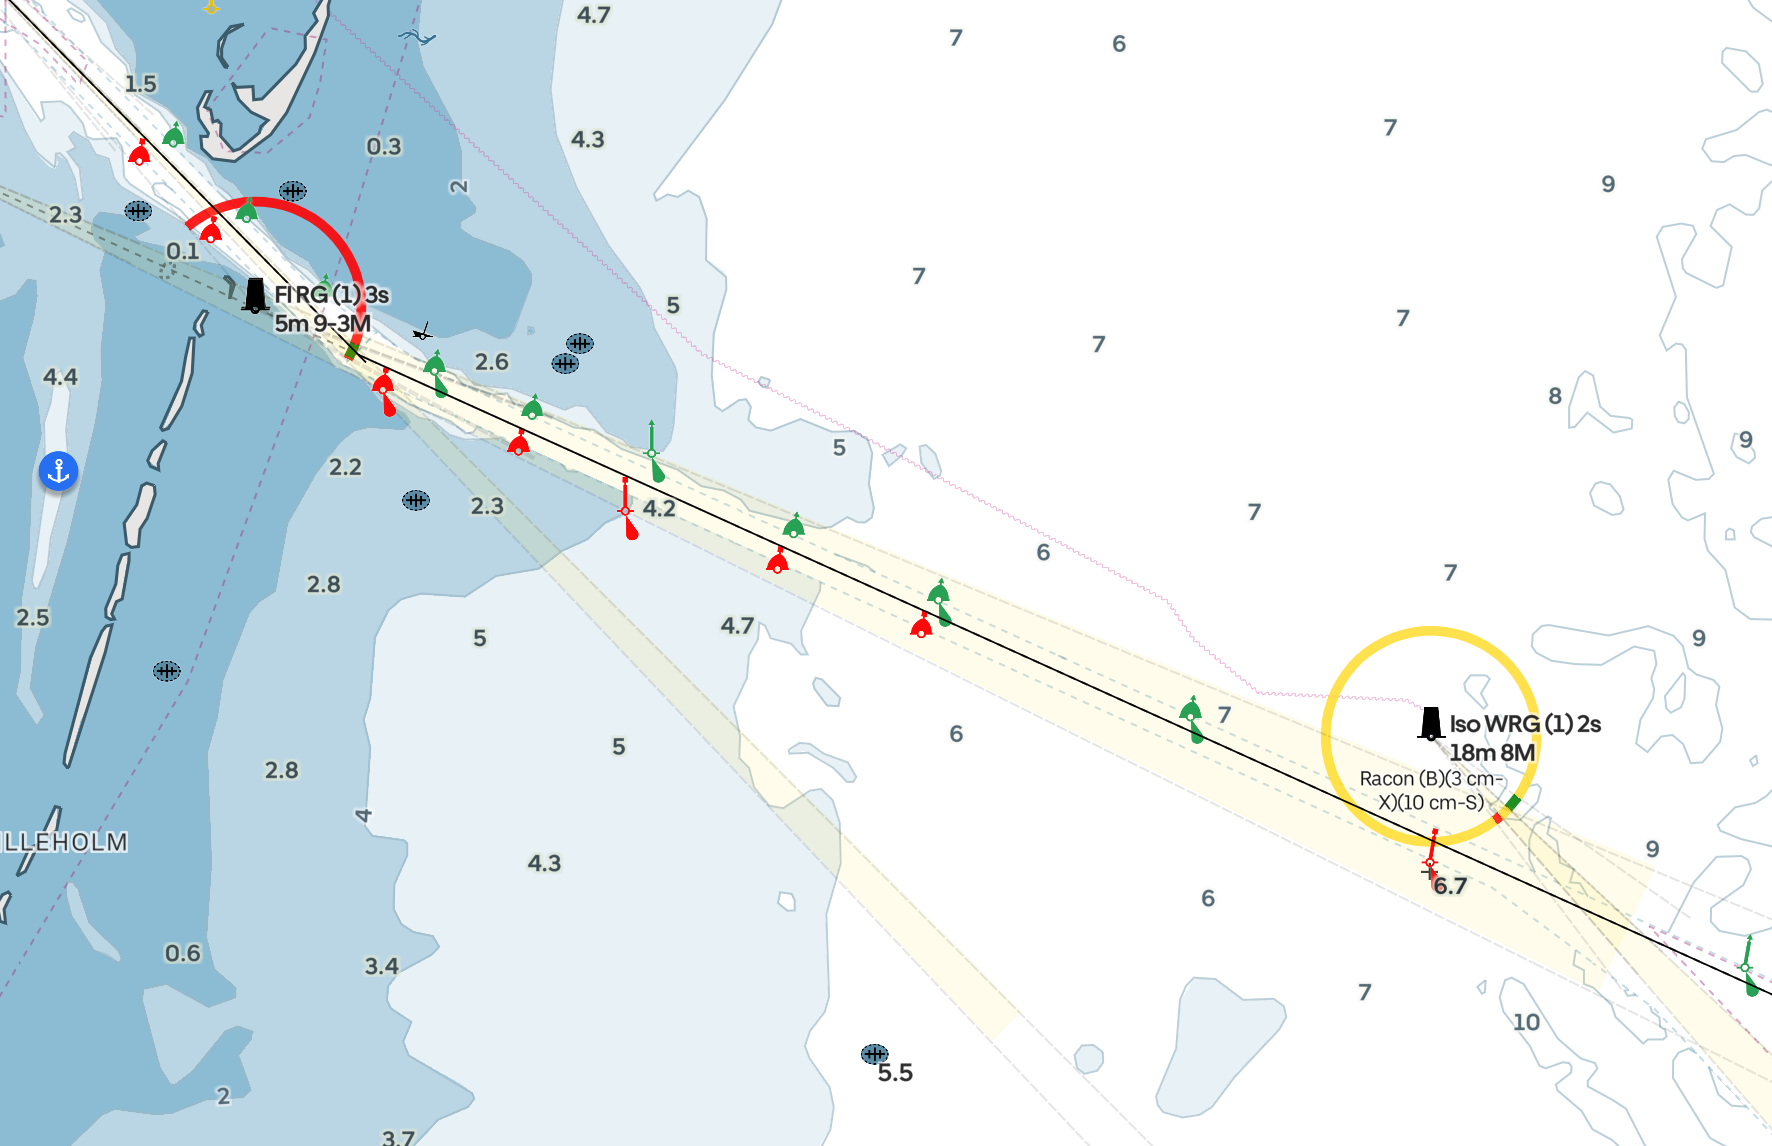
The approach to Hals is guided by several lighthouses. With distinctly different heights that are now presented in Orca Charts, they are now easy to separate at a distance.
4. Understand bridges at a glance
Bridges now display their name and type, such as fixed, opening, or swing bridge, above the vertical clearance label. This addition makes it easier to identify a bridge and understand if the bridge can open or not.
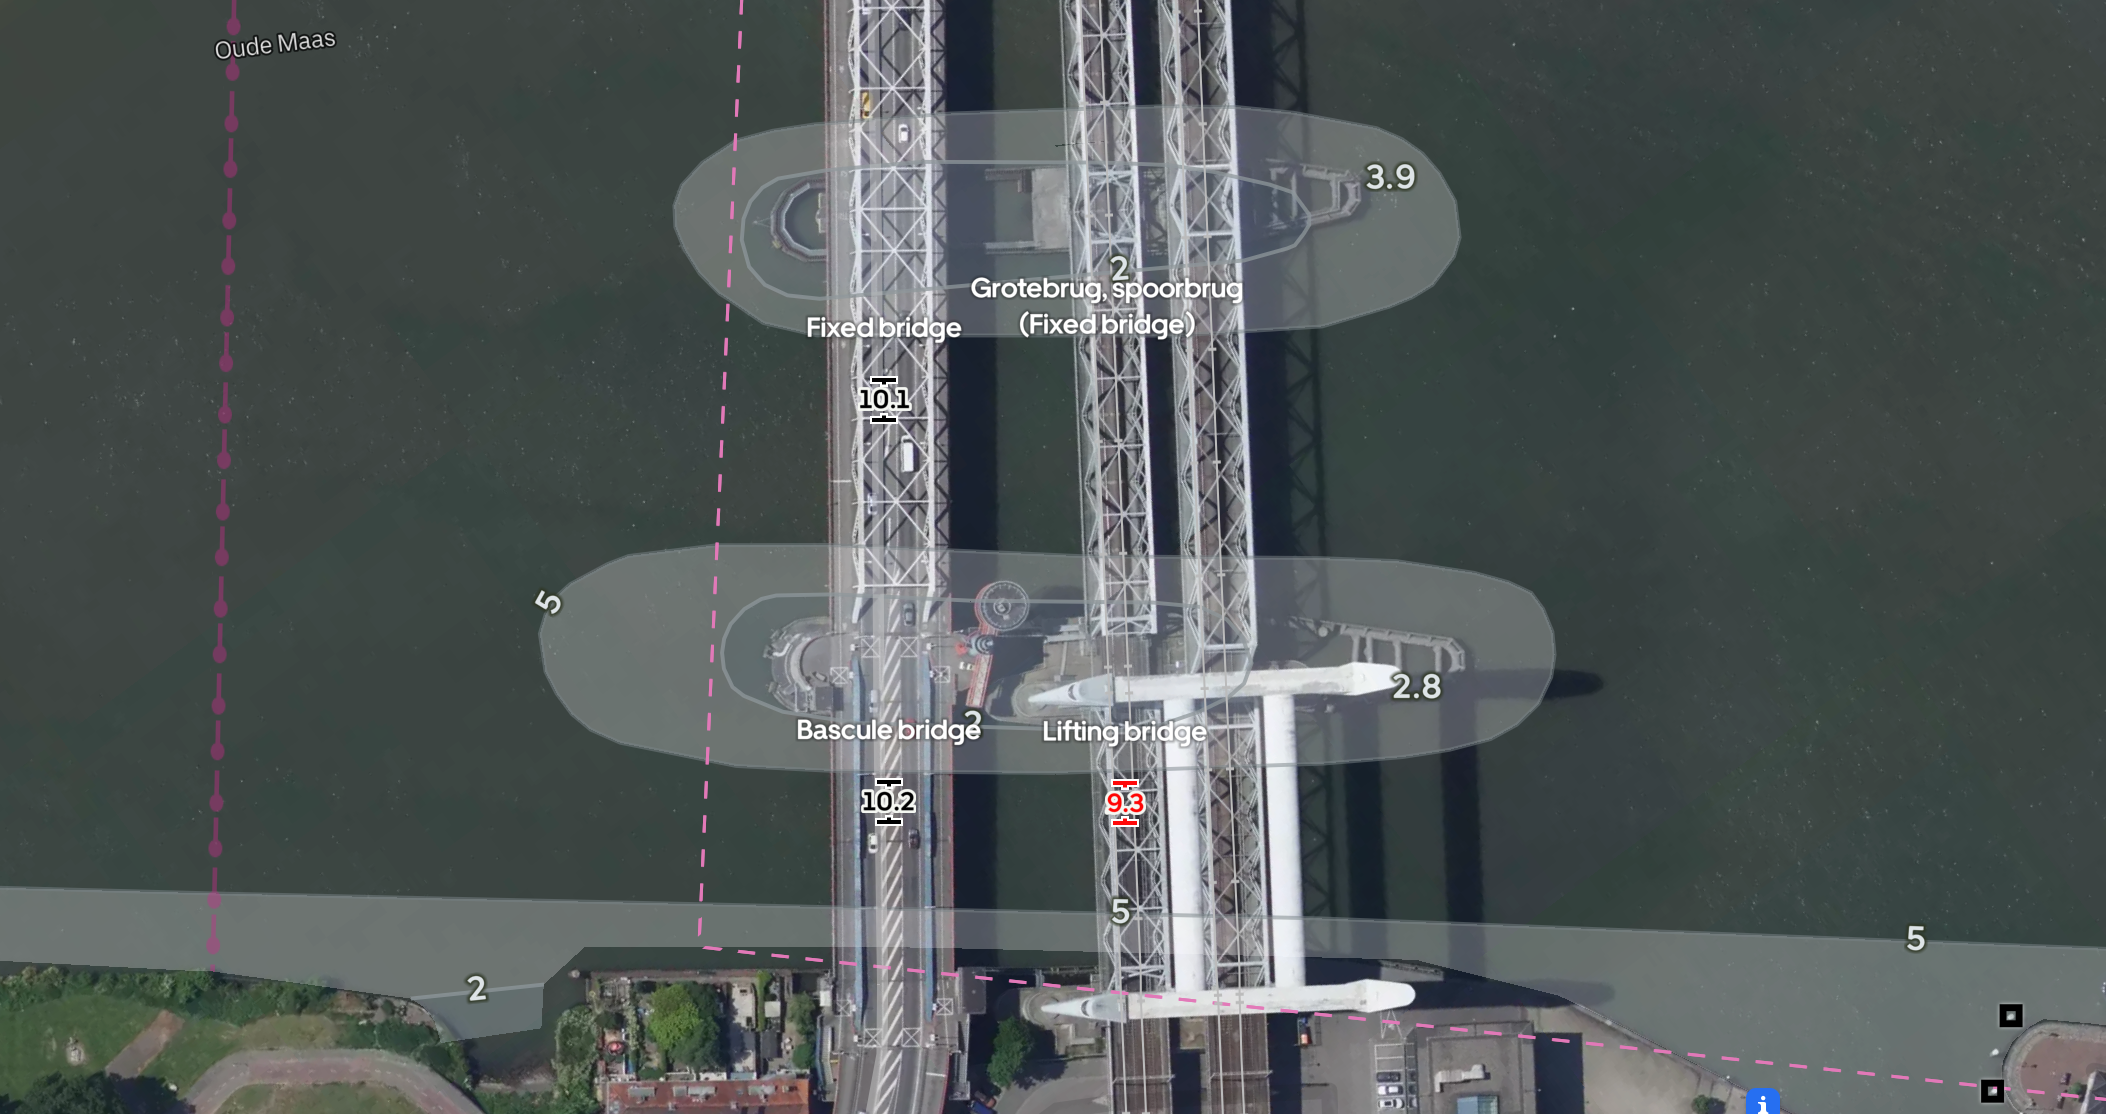
A close-up of the updated bridge labels from the Netherlands. The combination of easy-to-read labels and Orca's Satellite Hybrid charts gives a fantastic situational awareness prior to a bridge crossing.
5. Better information density at low zoom levels
Restricted areas, precautionary areas, and cautionary zones now appear at lower zoom levels. That means you no longer need to zoom in deeply to see if a passage is subject to special rules. Depth labels also appear at lower zoom levels, giving you bathymetry information at a glance.
Note: Most of the visual updates to Orca Charts are already available to all Orca users, while some are rolling out in the coming weeks as part of a data update.
Understanding Chart Symbols
Even experienced boaters occasionally forget what a specific symbol or area means in a marine chart. That’s why Orca comes with the Chart Info tool. The Chart Info tool is a simple way to get context and meaning behind a mark on the chart.
Long-press on a mark, and then tap View Info to understand the meaning of the mark.
Is that a Safe Water Mark or an Isolated Danger? Just long-press on a chart mark, then tap View Info. The Chart Info tool will tell you what the mark is and what it means for navigation. The Chart Info tool is incredibly helpful, letting you boat without a separate chart symbology guide.
This week’s update makes the Chart Info even better: You can now long-press on an area, such as a restricted zone or cautionary area, to get detailed information about the area.
Understand the details and extent of upcoming restrictions and caution zones with the upgraded Map Info tool.
Press View in map to get a visual highlight showing exactly where the area begins and ends. This makes it much easier to understand the extent of navigational restrictions around you.
Become a better boater with Orca
Orca is designed and built to help you navigate better and understand your surroundings. From clean map design, a smart Chart Info tool, to automatic route finding, and real-time weather forecasts, Orca delivers the tools and information you need for an enjoyable and safe day on the water.
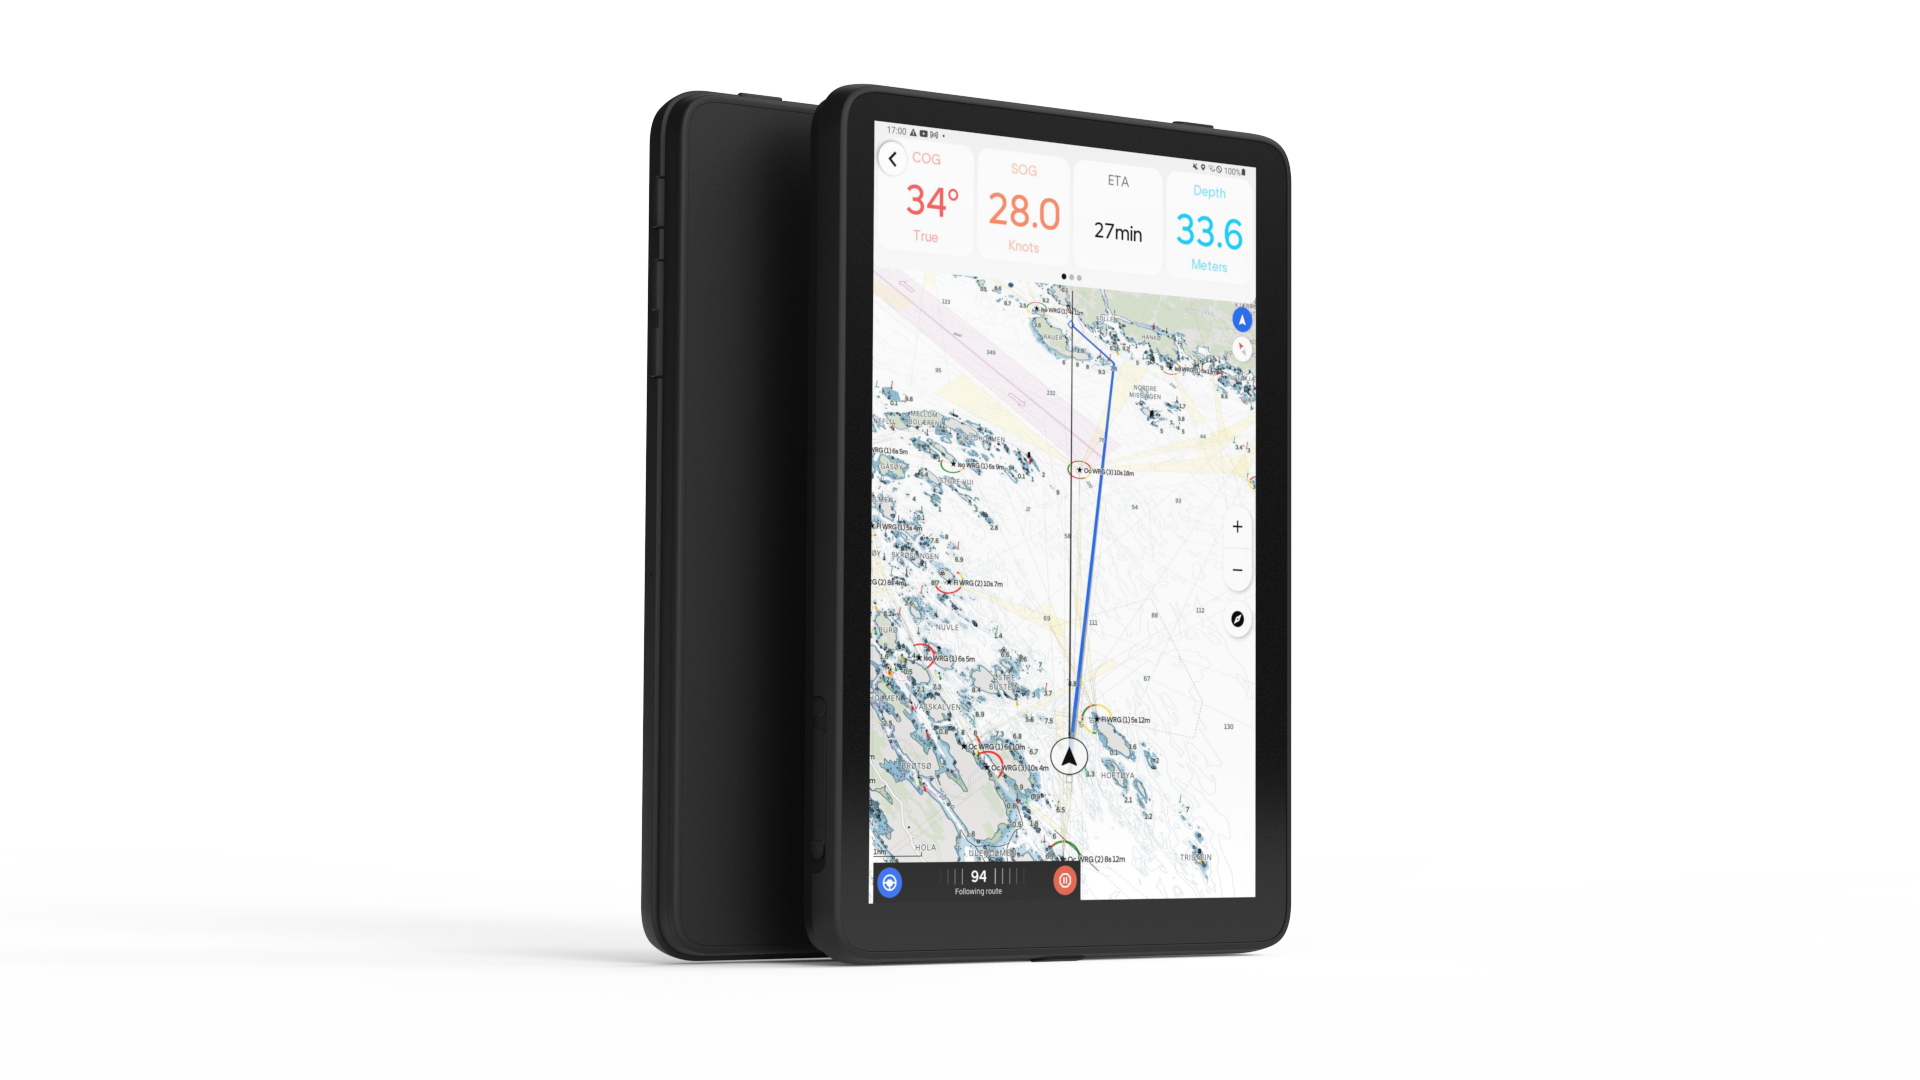
Orca Display 2 is a navigation display for the modern boater.
Add marine-grade devices that are built for accurate and reliable navigation, and you've got a navigation experience built for the modern boater. Looking to upgrade? Order now via the Orca Store, with free express shipping and a 30-day satisfaction guarantee.


